NFL Stadium Orientation Wind Analysis for Totals Bettors
 Available in US
I spent a December afternoon in 2021 watching a Bills game from a friend’s flat in Leeds, mildly irritated that my under ticket was dying. The wind at Highmark Stadium was reported at 22 mph sustained — well above the threshold where passing offences are supposed to stall. But Josh Allen kept throwing, and the ball kept arriving. It was not until I pulled up the stadium orientation data later that night that I understood why: the wind was blowing directly along the stadium’s long axis, creating a headwind-tailwind dynamic rather than a crosswind. Allen had the wind at his back in the second half and exploited it ruthlessly. That game taught me that wind speed alone is only half the story. The other half is which direction the stadium funnels it.
Every open-air NFL venue has a unique relationship with prevailing wind patterns. Some stadiums sit in natural wind corridors — lakefronts, river valleys, coastal plains — that amplify gusts well beyond what regional weather stations report. Others are built as enclosed concrete bowls that shield the playing surface from all but the most extreme conditions. Understanding these structural differences is not optional for a weather bettor; it is the difference between a model that works and one that merely looks clever.
Bowl and Open-End Stadium Designs Impact on Betting Lines
Walk into any NFL stadium and you will notice one of two basic shapes. The first is the full bowl — a continuous ring of seating that wraps 360 degrees around the field with no significant gaps in the upper structure. The second is the open-end design, where one or both ends of the stadium are left partially or fully open, either for aesthetic reasons, to accommodate a scoreboard structure, or simply because the venue was built in phases and never completed the enclosure.
The aerodynamic consequences of these two designs are stark. A full-bowl stadium acts as a wind shield. Air flowing across the top of the structure creates turbulence above the upper deck but rarely penetrates to field level with any consistent force. Arrowhead Stadium in Kansas City is the textbook example: despite sitting on an exposed Missouri hilltop, the bowl design keeps field-level winds significantly below what the nearest weather station registers. I have logged multiple games where the airport weather station five miles away reported 18 mph sustained wind while reporters on the field described conditions as breezy but manageable.
Open-end stadiums behave differently. When prevailing wind aligns with the open end, the gap acts as a funnel, accelerating airflow across the playing surface. The effect is most pronounced when the opening faces the dominant wind direction for that region. MetLife Stadium in East Rutherford, New Jersey is oriented with its open ends roughly north-south, and the prevailing autumn winds in the New York metropolitan area blow west to east — meaning MetLife typically experiences crosswind rather than a direct funnel. But when a nor’easter pushes wind from the northeast, the alignment shifts and the open end channels gusts directly down the field.
For bettors, the practical distinction is this: in a bowl stadium, reported wind speeds from nearby weather stations tend to overstate conditions on the field. In an open-end stadium aligned with the wind, they may understate them. The relationship between reported wind and experienced wind is not constant — it depends on the building’s geometry.
Windiest Venues Ranked
Which open-air stadiums consistently produce the highest field-level wind speeds? I have been compiling this data for six seasons, cross-referencing NOAA station reports with in-stadium observations from beat reporters and broadcast graphics. The ranking is not static — a stadium’s effective windiness depends on that day’s wind direction — but some venues appear near the top with remarkable consistency.
Highmark Stadium in Orchard Park sits at or near the top of every list. Buffalo’s stadium occupies an exposed position south of the city, with Lake Erie to the west generating powerful lake-effect weather systems from November onward. The stadium’s open-end design — the north end is partially exposed — channels lake-driven westerly winds across the field with minimal obstruction. Average field-level wind speed during December and January Bills home games has exceeded 14 mph in four of the last six seasons. That is a baseline, not an extreme; individual games have seen sustained winds above 25 mph.
Soldier Field in Chicago ranks close behind. The stadium sits on the Lake Michigan shoreline, exposed to easterly and northeasterly winds that come off the water with nothing to break them. The venue’s partial rebuild in 2003 created an unusual hybrid structure — a modern bowl inserted within the shell of the original columned exterior — that does not shield the field as effectively as a purpose-built bowl. Wind at Soldier Field is less about the stadium’s orientation and more about its geography: you cannot build a windbreak against Lake Michigan.
Gillette Stadium in Foxborough occupies an exposed site in southeastern Massachusetts and experiences consistent wind during the late season. The stadium is a full bowl but sits on a plateau with no surrounding tree cover or urban density to dampen incoming air. New England’s coastal weather patterns push wind from multiple directions, and Gillette’s elevation means the field catches more of it than a stadium nestled in a valley would.
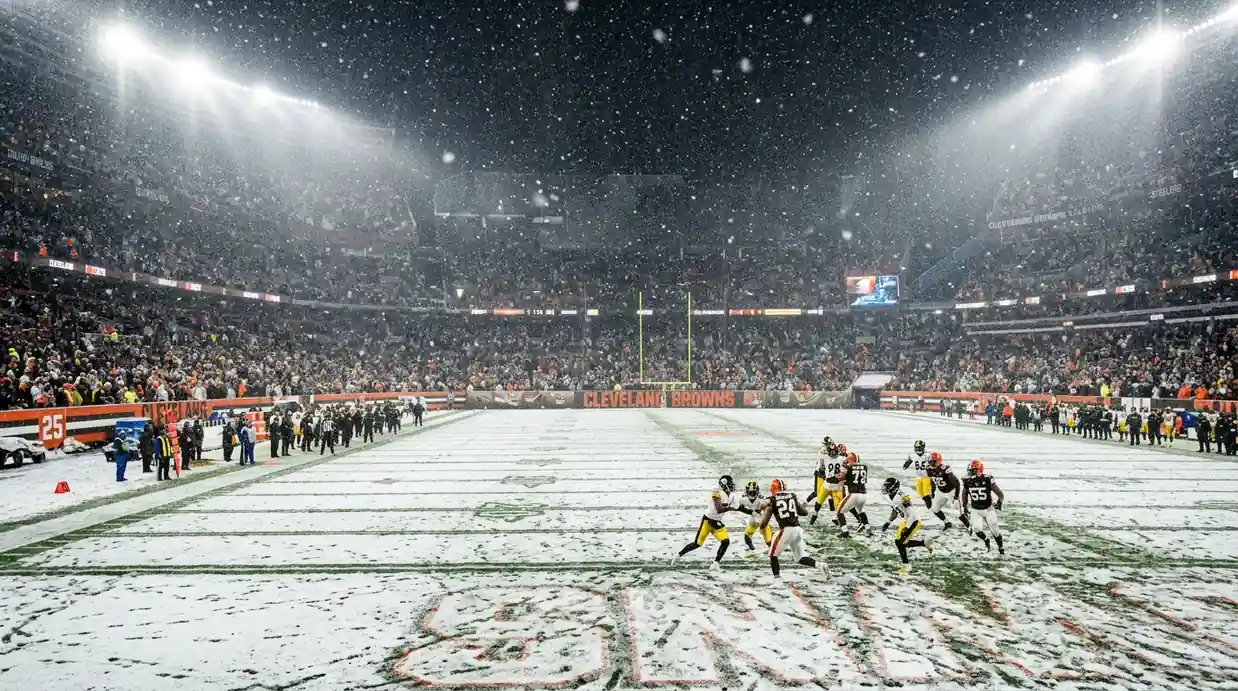
Other notably windy venues include Cleveland’s Huntington Bank Field (Lake Erie exposure on the north side), Lambeau Field in Green Bay (open terrain and Great Lakes proximity), and TIAA Bank Field in Jacksonville (river-adjacent with occasional Atlantic wind patterns during autumn). Mild-climate stadiums like Levi’s Stadium in Santa Clara and SoFi Stadium in Inglewood rarely feature on windy-day lists because of their protected geography and the region’s calmer atmospheric patterns.
Quirks: Highmark, MetLife, Soldier Field
Some stadiums have wind behaviours so specific that they deserve individual attention. I will walk through the three I have studied most closely, because understanding their quirks has directly improved my betting results in games at these venues.
Highmark Stadium’s signature trick involves what I call the “swirl zone.” When westerly winds hit the open north end of the stadium, they do not simply blow straight through. The curved bowl structure on the east and west sides deflects some of that air downward and back toward midfield, creating a circular current that affects punts and deep throws unpredictably. Kickers at Highmark have described balls “dying” in mid-flight even with a tailwind, because the swirl catches the ball at the apex of its arc and pushes it sideways. The effect is strongest in the 20-to-30-yard altitude range, which is precisely where field goals and deep passes travel. My over-under model adds a 0.5-point penalty to Highmark’s total specifically for this swirl effect whenever sustained wind exceeds 15 mph from the west or northwest.
MetLife Stadium presents a different challenge. As a relatively modern stadium with two open ends oriented roughly north-south, its wind profile depends almost entirely on whether the day’s wind direction aligns with that axis. On a typical autumn day with westerly wind, MetLife plays close to a full-bowl environment — the tall west and east sides block most of the airflow. But during nor’easters or any weather system pushing air from the northeast, the wind races through both open ends and creates a sustained corridor effect. I check the angle between forecast wind direction and MetLife’s 015-degree long-axis orientation before every Giants and Jets home game. If the difference is less than 30 degrees, I treat the game as a genuine wind game regardless of what the weather station reports.
Soldier Field’s quirk is elevation-dependent. The lower bowl, sheltered by the rebuilt structure, is relatively calm even on windy days. But the playing surface sits close to ground level, and the open end facing east toward Lake Michigan acts as an intake for onshore breezes. The result is a venue where sideline reporters describe manageable conditions while the ball behaves erratically at 30 feet above the turf. I have seen multiple field goal attempts at Soldier Field curve visibly in flight despite modest reported wind speeds, because the air moving through the eastern opening accelerates as it enters the narrower channel between the stadium’s inner walls.
Using Orientation for Totals
So how does all of this translate to a pre-game routine? My process starts with two pieces of information that take less than a minute to gather: the stadium’s long-axis compass bearing and the forecast wind direction at kickoff. The difference between those two numbers tells me whether the game will feature headwind-tailwind conditions (small angle, wind blowing along the field), crosswind (large angle, wind blowing across the field), or something in between.
Crosswind is the scenario I care about most. As I have discussed in my analysis of wind-driven passing yard losses, crosswind produces a higher field goal miss rate than equivalent-speed headwind at distances beyond 35 yards. A stadium whose long axis runs perpendicular to the day’s wind direction turns a 15 mph breeze into a genuine kicking problem. The same 15 mph wind blowing along the long axis creates headwind for one team and tailwind for the other, which partly cancels out over the course of a full game as teams switch ends at halftime.
For totals, my orientation adjustment works on a sliding scale. If the wind-to-axis angle is less than 20 degrees (near-pure head-tail), I apply no additional discount beyond the standard wind-speed adjustment. Between 20 and 45 degrees, I add a 0.5-point discount for crosswind effects on kicking. Above 45 degrees — near-pure crosswind — the discount increases to 1 to 1.5 points, weighted by wind speed. This is a rough framework, not a precise formula, but it has been profitable over four seasons of application.
One final consideration: wind direction often shifts during a game, particularly in the late afternoon as thermal patterns change. A game that starts with headwind-tailwind can shift toward crosswind by the fourth quarter if the wind rotates 30 degrees. I do not try to predict these shifts — weather forecasting is imprecise enough without adding intra-game wind rotation to the model. Instead, I use the kickoff forecast as my reference point and accept that some variance will come from conditions evolving after the bet is placed.
The Compass Reading Behind Every Wind Bet
Stadium orientation is one of those variables that sounds esoteric until you realise how directly it connects to the numbers on your bet slip. A 20 mph wind at a bowl stadium may produce calmer field conditions than a 12 mph breeze at an open-end venue aligned with the gusts. The weather station number is the starting point; the stadium’s architecture and compass bearing tell you what that number actually means at field level. I keep a simple spreadsheet with the long-axis orientation of every open-air NFL venue, updated each season for any structural changes. It takes five minutes to build and saves me from misreading wind conditions multiple times per year. In a sport where a single point decides more than a third of totals bets, those five minutes are the best investment I make.
How do I find the compass orientation of an NFL stadium?
The simplest method is satellite imagery. Open any map application, find the stadium, and note the angle of the field relative to north. Most NFL fields run roughly northeast-southwest or north-south, but the exact angle varies by 10 to 20 degrees between venues. Cross-reference this with the forecast wind direction from NOAA or a weather aggregator to determine whether the game faces headwind, tailwind, or crosswind conditions.
Does a full-bowl stadium eliminate wind effects entirely?
Not entirely, but it reduces them significantly. Bowl stadiums shield the field from most surface-level wind, meaning reported wind speeds from nearby weather stations often overstate conditions on the playing surface. Field-level wind in a full bowl is typically 30 to 50 percent lower than the nearest weather station reading, depending on wind direction and stadium height.
Written by the editors at Weather Impact on nfl Betting.