Best NFL Weather Betting Tools: From RotoGrinders to Bettor Weather
 Available in US
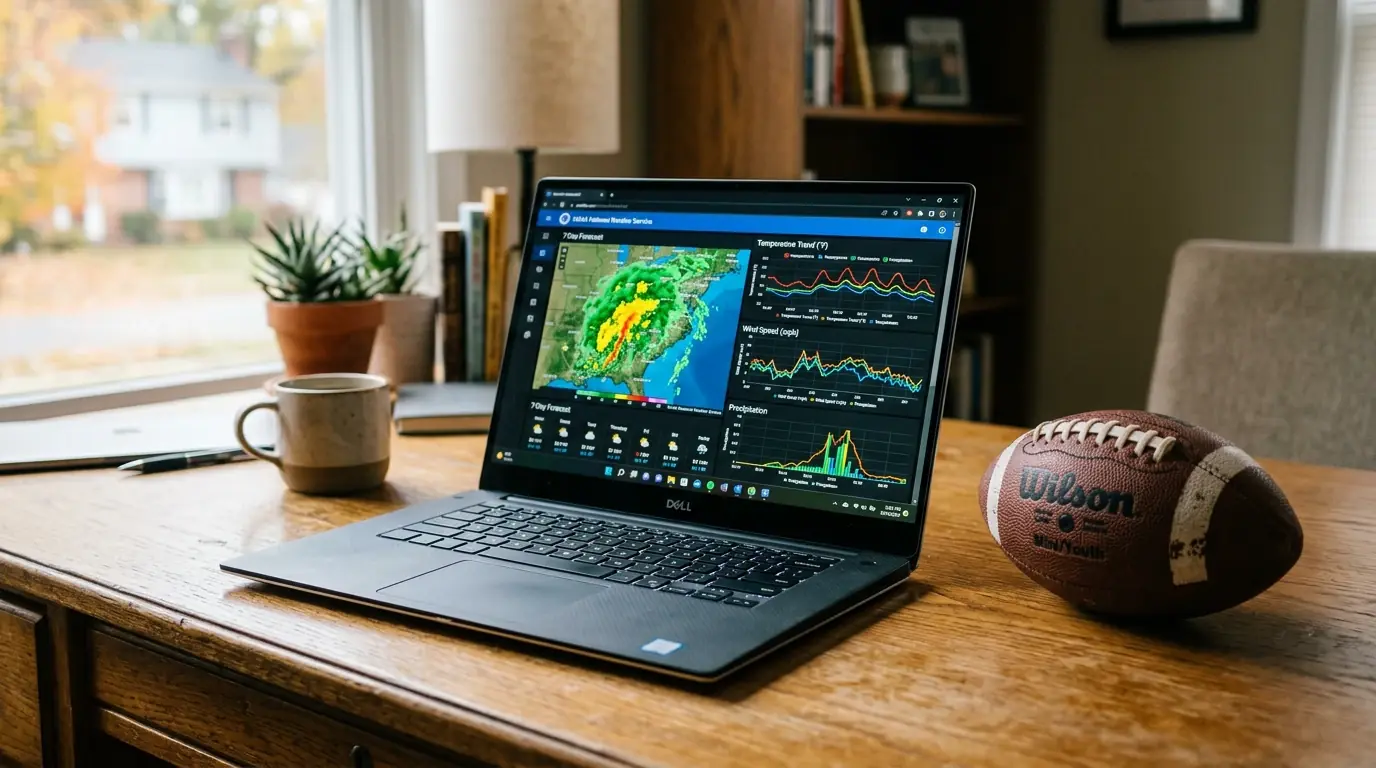
Four years ago my NFL weather research consisted of typing a stadium name into Google followed by the word “weather” and hoping for the best. The forecast I found was usually for the nearest city centre, not the stadium itself, and it updated once a day at a time that had nothing to do with kickoff. I was making weather-adjusted bets based on data that was barely better than guessing. The tools I use now are not expensive — most are free — but they transformed the quality of my weather reads overnight.
The NFL weather-tool landscape is dominated by a handful of dedicated platforms, each with a different philosophy. Some prioritise speed, giving you a colour-coded dashboard you can scan in thirty seconds. Others prioritise depth, offering stadium-specific wind modelling and percentile comparisons against historical games. This is a practical guide to which tools do what, where they fall short, and how a UK-based bettor can stitch them together into a reliable pre-game routine.
The RotoGrinders Weather Page
RotoGrinders is the name that comes up first in every conversation about NFL weather and betting, and for good reason. Their weather dashboard is the most widely used free tool in the space, offering a single-page view of conditions for every game on the slate. Each game gets a colour-coded indicator — green, yellow, or red — based on wind speed, precipitation probability, and temperature. Kevin Roth, the platform’s chief meteorologist, has been vocal about the intersection of weather and wagering: as he told ESPN, sports betting has “opened up the floodgates to more people being interested in sports weather.”
The strength of the RotoGrinders page is its comprehensiveness and update frequency. During the season, the dashboard refreshes multiple times on game day, pulling from National Weather Service data. For a UK bettor scanning a 14-game slate on a Sunday afternoon, this is invaluable — you can identify which games have weather concerns in under a minute, then drill into those specific matchups with other tools.
The limitation is granularity. The RotoGrinders dashboard reports wind speed but not wind direction relative to stadium orientation. It flags precipitation but does not distinguish between a light drizzle and a heavy downpour in a way that maps onto specific scoring adjustments. And its historical percentile feature, while useful, does not allow you to filter by specific weather thresholds (say, all games with sustained wind above 18 mph at a particular venue). I use RotoGrinders as my first filter — the tool that tells me where to look — and then move to more specialised resources for the games that matter.
Bettor Weather Stadium Models
Bettor Weather, co-founded by meteorologist Ivetta Abramyan, takes a fundamentally different approach from aggregator-style tools. Rather than reporting raw weather data, it builds stadium-specific models that account for venue geometry, prevailing wind patterns, and the interaction between wind direction and the field’s long axis. Abramyan has emphasised that wind will “force the teams to run the ball more, reducing the number of possessions” and cause “inaccuracies with kicking direction and loss of distance” — effects that vary dramatically depending on whether the wind creates a crosswind or a headwind at any particular stadium.
The practical output is a game-by-game impact rating that goes beyond simple wind speed. A 15 mph wind at MetLife might receive a lower impact score than a 12 mph wind at Soldier Field, because MetLife’s tall side structures block typical westerly winds while Soldier Field’s lakefront exposure amplifies them. This is the kind of nuance that raw NOAA data cannot provide without manual interpretation.
For UK bettors, the main drawback is access. Bettor Weather’s most detailed outputs are behind a subscription wall, and the pricing is oriented toward American DFS and betting markets. Whether that cost is justified depends on your volume. If you are placing weather-driven bets on two or three games per week during the season, the subscription may pay for itself. If weather betting is an occasional supplement to your main strategy, the free tools likely cover your needs.
Parlay Savant and CapperTek
These two platforms occupy the analytical middle ground between RotoGrinders’ dashboard simplicity and Bettor Weather’s modelling depth. Parlay Savant’s weather analysis has produced some of the most widely cited data in this niche, including the finding that every 5 mph of wind reduces NFL completion percentage by 2 to 3 percentage points. CapperTek’s contribution is equally specific: their five-season analysis showing completion rate falling from 60.3 percent to 54.65 percent at wind speeds of 20 to 25 mph has become a standard reference point for weather-adjusted total modelling.
Neither platform is primarily a weather tool — both are broader betting analytics services that include weather as one dimension of their analysis. The advantage of this approach is context. When CapperTek reports that QB fantasy production drops by 2.1 points per game in adverse conditions, that number sits alongside the quarterback’s full statistical profile, injury history, and matchup data. You do not need to manually combine weather and performance data from separate sources.
The disadvantage, again, is UK accessibility. Both platforms are built for the American market, with time stamps in Eastern Time, odds in American format, and sportsbook references that may not map to UK-licensed books. The data itself is universally applicable — wind affects a football the same way regardless of which country you bet from — but the presentation requires some translation.
Building Your Own Spreadsheet
After three seasons of relying entirely on third-party tools, I built a simple spreadsheet that has become the backbone of my weather analysis. It is not sophisticated. It pulls NOAA hourly forecasts for each outdoor game, maps wind direction against my stadium orientation reference table, and applies the scoring adjustments I have derived from historical data: roughly minus 2 points for light rain, minus 6 for heavy rain, minus 1 to 3 for wind above 15 mph depending on direction, and a graduated temperature penalty below 40 degrees Fahrenheit.
The advantage of a personal spreadsheet is that it forces you to engage with the data rather than accepting someone else’s interpretation. When my spreadsheet says a game’s total should be 3 points lower than the posted number and Bettor Weather’s model says 1.5, I have to think about why they disagree. That thinking process — comparing my assumptions against a professional model — has improved my weather reads more than any single tool.
You do not need programming skills to build something useful. A basic spreadsheet with columns for each weather variable, a simple lookup table for adjustments, and a comparison against the closing total is enough to start. The data from NOAA is free and available in a format that copies into any spreadsheet application. Start tracking this season and by next autumn you will have a personal dataset that no commercial tool can replicate.
Choosing the Right Stack for Your Approach
No single tool covers everything a weather-aware NFL bettor needs. RotoGrinders gives you speed and breadth. Bettor Weather gives you depth and stadium specificity. Parlay Savant and CapperTek give you statistical context. And a personal spreadsheet gives you ownership of the analysis. My stack uses all four, layered in sequence: RotoGrinders to screen, NOAA to verify, CapperTek to quantify, and my spreadsheet to decide. The entire process takes twenty to thirty minutes on a Sunday afternoon, and it has been the most consistently profitable part of my NFL betting routine for four consecutive seasons.
Are any of these tools genuinely UK-friendly?
RotoGrinders is the most accessible from the UK — free, web-based, and requiring no account for basic weather data. The main friction is time zones: all kickoff times are displayed in US Eastern, so UK bettors need to add five hours during GMT. Bettor Weather and CapperTek are subscription services oriented toward the American market, but their data is universally applicable.
Do I need a paid subscription to gain a real edge?
Not necessarily. NOAA data is free and is the upstream source most paid tools derive from. A disciplined bettor who checks NOAA directly and maintains a personal spreadsheet can replicate roughly 80 to 90 percent of what paid services offer. Paid tools add convenience and stadium-specific modelling, which saves time but is not essential for a profitable approach.
Published by the Weather Impact on nfl Betting team.