NFL Percentile Weather Comparison Method: Benchmarking Against History
 Available in US
The first time I saw a 17 mph wind forecast for an NFL game, I bet the under without thinking twice. The second time, I bet the under again. The third time, I noticed I was losing money. The problem was not the wind — it was my frame of reference. Seventeen mph sounds like a lot until you realise that the historical average wind speed across NFL games is roughly 7 mph, meaning 17 mph is unusual but not extreme. I was overweighting a moderate condition because I lacked a systematic way to rank it against history.
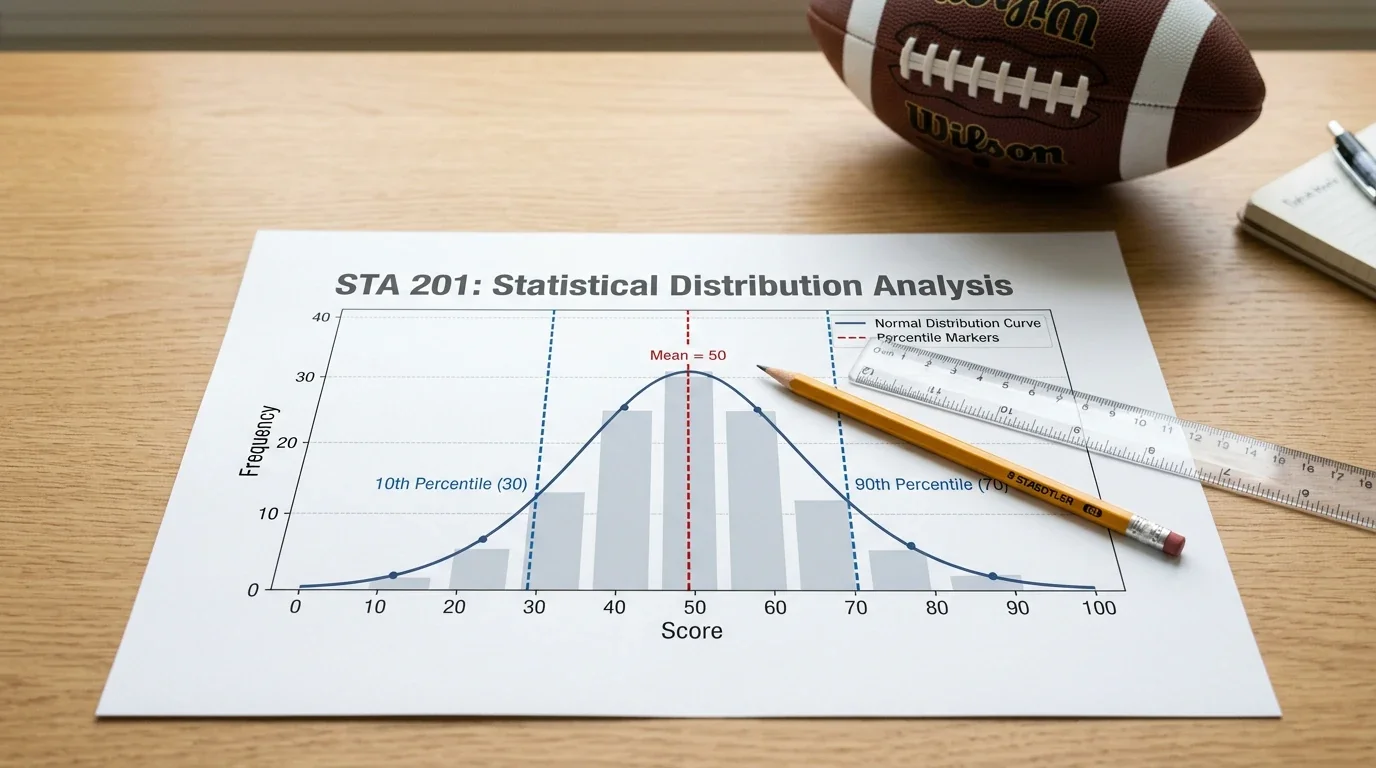
The percentile method solved that problem. Instead of reacting to a raw number, I now place every weather reading on a scale of 0 to 100 based on where it falls in the distribution of all recorded NFL game conditions. A 17 mph wind might land at the 88th percentile — genuinely windy, but not the 98th-percentile gale I had been treating it as. That distinction changes my bet size, and sometimes it changes whether I bet at all. An analysis of over 13,000 NFL games dating back to 1966 confirms that wind speed and temperature are statistically significant predictors of scoring output, but the relationship is non-linear, which is precisely why percentiles outperform raw thresholds.
Why Percentiles Beat Raw Numbers
Raw weather numbers are deceptive because they lack context. A temperature of 25 degrees Fahrenheit (minus 4 degrees Celsius) sounds freezing — and it is — but for a December game in Green Bay, it is entirely normal. The same temperature for a December game in Charlotte is unusual enough to warrant a genuine adjustment. Percentiles capture this distinction automatically.
When I say a game is being played at the 90th percentile for wind, I mean that only 10 percent of all NFL games in the historical record were played in windier conditions. That tells me something a raw number cannot: this game’s weather is genuinely abnormal relative to the full range of conditions the league has experienced. The scoring adjustments I apply are calibrated to percentile bands rather than fixed thresholds, which produces a smoother and more accurate model than the step-function approach of “15 mph = small effect, 20 mph = big effect.”
The non-linearity is important. Moving from the 50th to the 70th percentile of wind conditions produces a modest scoring effect. Moving from the 70th to the 90th produces a sharper decline. And moving from the 90th to the 99th produces a dramatic collapse in passing efficiency and field goal accuracy. A linear model that treats each mph equally misses this curvature. Percentiles embed the curvature automatically because the distribution of NFL game conditions is itself non-linear — there are many games at low wind speeds and very few at extreme speeds.
For temperature, the same logic applies. The scoring penalty between 45 and 35 degrees Fahrenheit is small. Between 35 and 20 degrees, it steepens. Below 10 degrees, it steepens again. Percentiles capture each of these inflection points without requiring me to define arbitrary thresholds.
The RotoGrinders Approach
RotoGrinders was one of the first platforms to incorporate percentile-based weather comparison into its NFL coverage. Their system ranks each game’s conditions against a historical database and presents the result as a simple percentile score. A game at the 95th percentile for wind is flagged as a high-impact weather event; a game at the 60th percentile is noted but not alarming.
The value of the RotoGrinders approach is accessibility. You do not need to build your own database or run your own calculations — the platform does it for you and presents the result in a format that takes seconds to interpret. For UK bettors who are time-pressed on a Sunday afternoon, this is the fastest way to identify which games have genuinely unusual weather and which are within normal parameters.
The limitation is transparency. RotoGrinders does not publish the full details of its percentile methodology — which historical dataset it uses, how it handles missing data points, or whether it adjusts for stadium-specific effects. Without that transparency, you are trusting the platform’s interpretation rather than verifying it yourself. For casual weather bettors, that trust is reasonable. For bettors who want to build a genuine edge, it is worth building your own comparison baseline.
Building a 13,000-Game Baseline
The dataset that underpins my own percentile system draws from the same kind of source that academic researchers have used — a comprehensive record of weather conditions at NFL games stretching back decades. One widely cited analysis, published on Kaggle by data scientist Eric Tyler, compiled weather data for over 13,000 NFL games from 1966 onward and found that wind speed and temperature were both statistically significant predictors of scoring.
Building your own version does not require 13,000 games. I started with the most recent ten seasons — roughly 2,700 regular-season games — which is large enough to produce stable percentile distributions for wind, temperature, and precipitation. The data is available through retrospective weather archives (NOAA’s Climate Data Online is the primary source) cross-referenced with game logs from publicly available databases.
The construction process is mechanical. For each game in your dataset, record the temperature, sustained wind speed, and precipitation at kickoff. Sort each variable independently from lowest to highest. Then, for any new game, find where its weather readings fall in those sorted distributions. If a game has 19 mph wind and your dataset shows that 85 percent of games had lower wind, the game sits at the 85th percentile.
I refresh my baseline once per season, adding the previous year’s games and dropping the oldest year. This keeps the distribution current — if NFL scheduling trends toward more dome games or more warm-weather early-season fixtures, the percentile benchmarks shift accordingly.
Applying It to This Weekend
The weekly application takes about ten minutes. On Saturday, I pull NOAA forecasts for every outdoor game on Sunday’s slate. I enter each game’s projected wind, temperature, and precipitation into my spreadsheet, which automatically returns the percentile ranking for each variable.
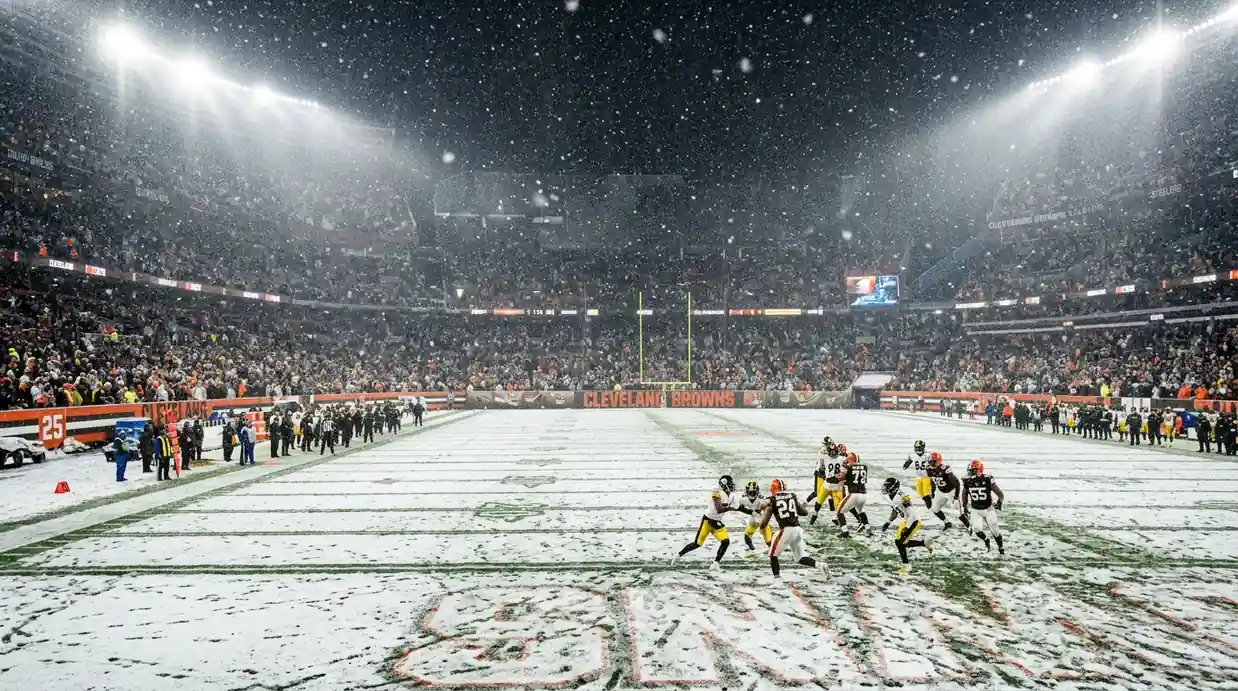
Any game with a weather variable above the 80th percentile gets flagged for closer analysis. Above the 90th percentile, I adjust my total estimate downward by a set amount based on the historical scoring patterns in that percentile band. Above the 95th, I treat the game as a high-confidence weather play and allocate a larger share of my bankroll if the total has not already moved enough to absorb the adjustment.
The beauty of this system is that it is self-calibrating. I do not need to decide whether 17 mph is “bad enough” to bet on — the percentile tells me where 17 mph sits relative to everything the NFL has experienced, and my adjustment scales accordingly. Some weeks the slate has no games above the 80th percentile for any variable, and I skip weather analysis entirely. Other weeks — late November, early December — half the outdoor games carry a weather flag, and my entire Sunday slate is built around those adjustments.
From Gut Feel to a Distribution
The percentile method is not a magic formula. It does not tell you which side to bet or guarantee a positive outcome. What it does is replace subjective reactions to weather numbers with a structured comparison against the full range of historical conditions. That single shift — from “17 mph sounds bad” to “17 mph sits at the 88th percentile, which historically corresponds to a 1.5-point scoring reduction” — has made my weather betting measurably more consistent. The dataset is free. The methodology is simple. The improvement is real.
What dataset should I start with to build percentiles?
The most recent ten seasons of NFL regular-season games (roughly 2,700 games) provides a stable enough sample. Cross-reference NOAA Climate Data Online for historical weather with publicly available game logs. You need three variables per game: kickoff temperature, sustained wind speed, and precipitation presence. Refresh annually by adding the new season and dropping the oldest.
Are percentiles useful for in-play betting?
Less directly. Percentiles are most valuable as a pre-game screening tool because they compare forecast conditions against historical distributions. During the game, raw conditions (current wind speed, active rainfall) matter more than their historical ranking. However, if conditions deteriorate mid-game beyond what was forecast, a quick percentile check can help you gauge whether the new conditions are genuinely extreme or merely unusual.
Created by the ”Weather Impact on nfl Betting” editorial team.